Cleveland Museum of Natural History
Three science interactives for the museum's $150M transformation. Visitors measure, trace, and crank their way through the science instead of watching it.
Overview
Three science interactives for the museum's $150M transformation. Each one asks visitors to do the science, not just read about it.
G&A was the exhibition and experience design partner for the museum's renewed galleries and interactive media. As UX designer, I owned the experience structure of three pieces: the Biodiversity Table, Identify It!, and the Mechanics of Evolution.
For each one, I created the visitor flow and wireframes, tested the concept, and went on site for installation. The visuals, motion, and code were built on that structure.
What shaped the design
Most decisions came down to two questions: how much science a casual visitor can take in, and how the hardware behaves in a real gallery.
- Core ideas first. I kept the key message up front and moved longer explanations into optional deep-dive layers, supported by animated graphics. In testing, visitors stayed longer and could explain the core concepts back to us.
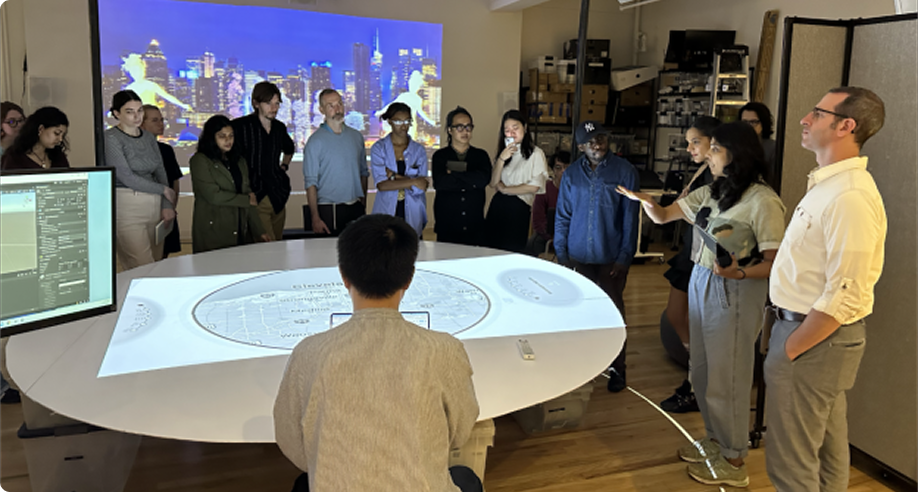
- Built for groups. The Biodiversity Table is a large multi-user touch table, so the flow had to work for several people at once.
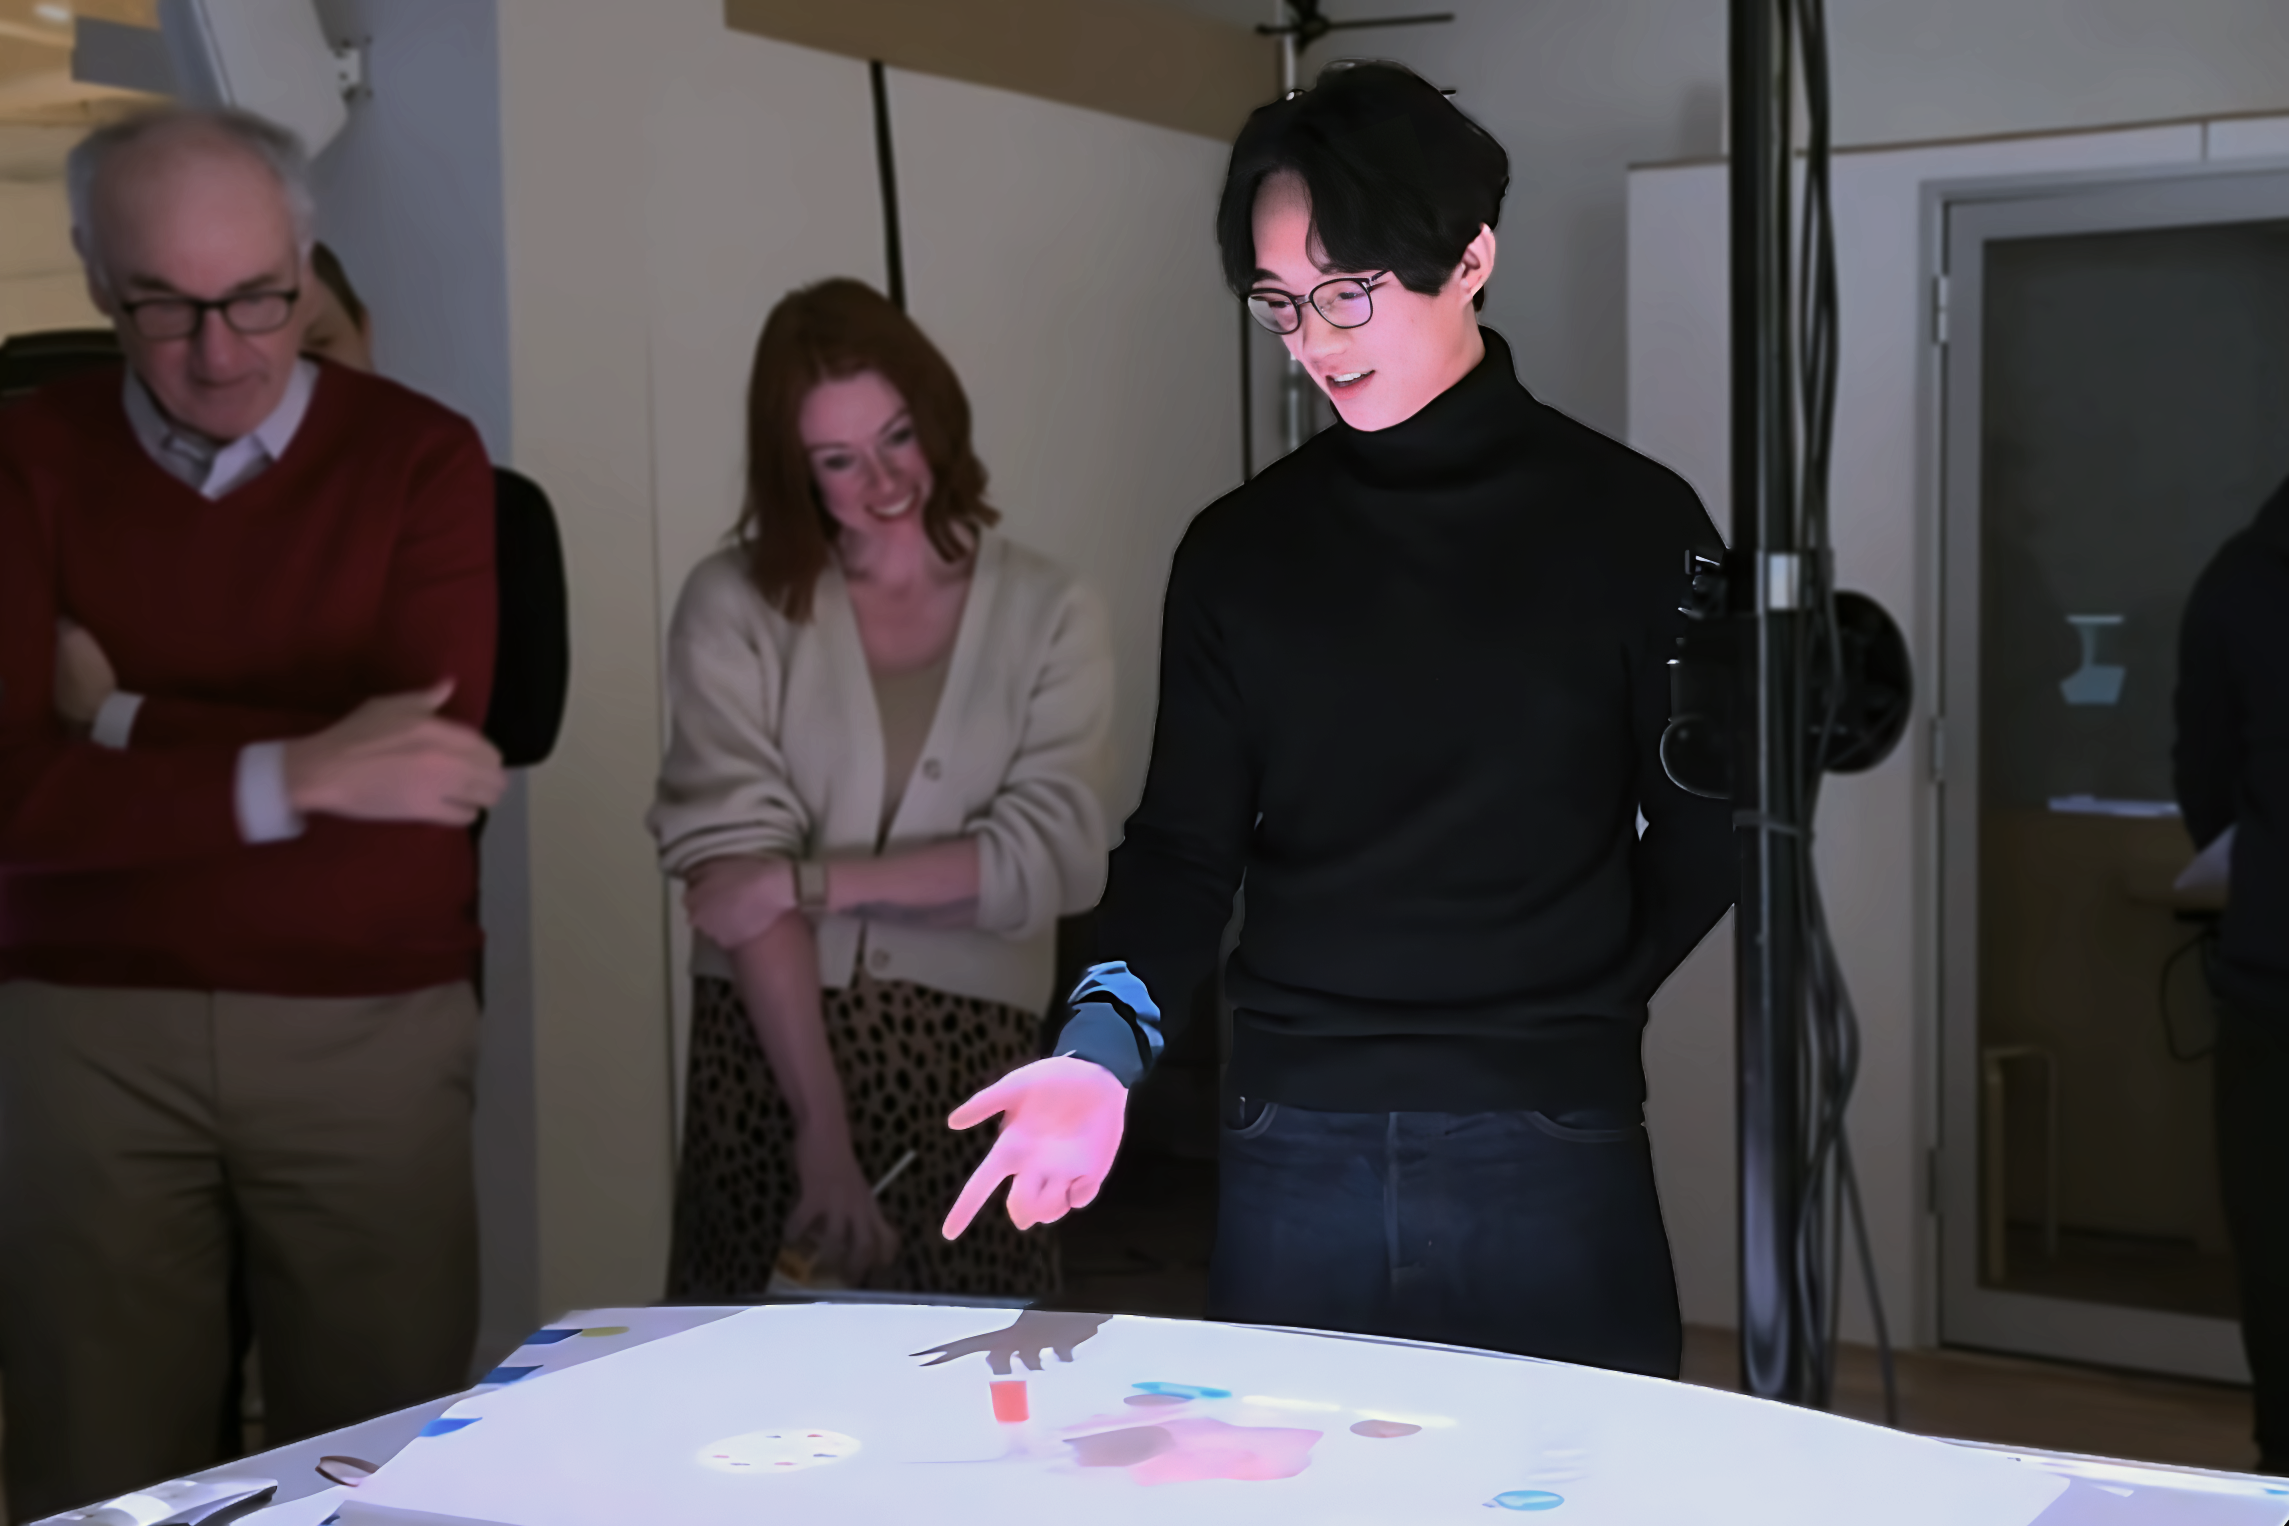
- Tested before build. For the Biodiversity Table, I ran six concept tests with 20+ participants, from a ten-year-old to college students, walking each through the wireframes in sequence.
- Fixed in the gallery. On site, the projection read too dim in the ambient light and the touchscreens had dead zones. I raised the visual contrast and moved interactive elements away from the affected edges.
Three interactives, three ways to do science
In each piece, the interaction is the lesson. What visitors do with their hands mirrors what scientists do in the field.
Explore the data, then see the story
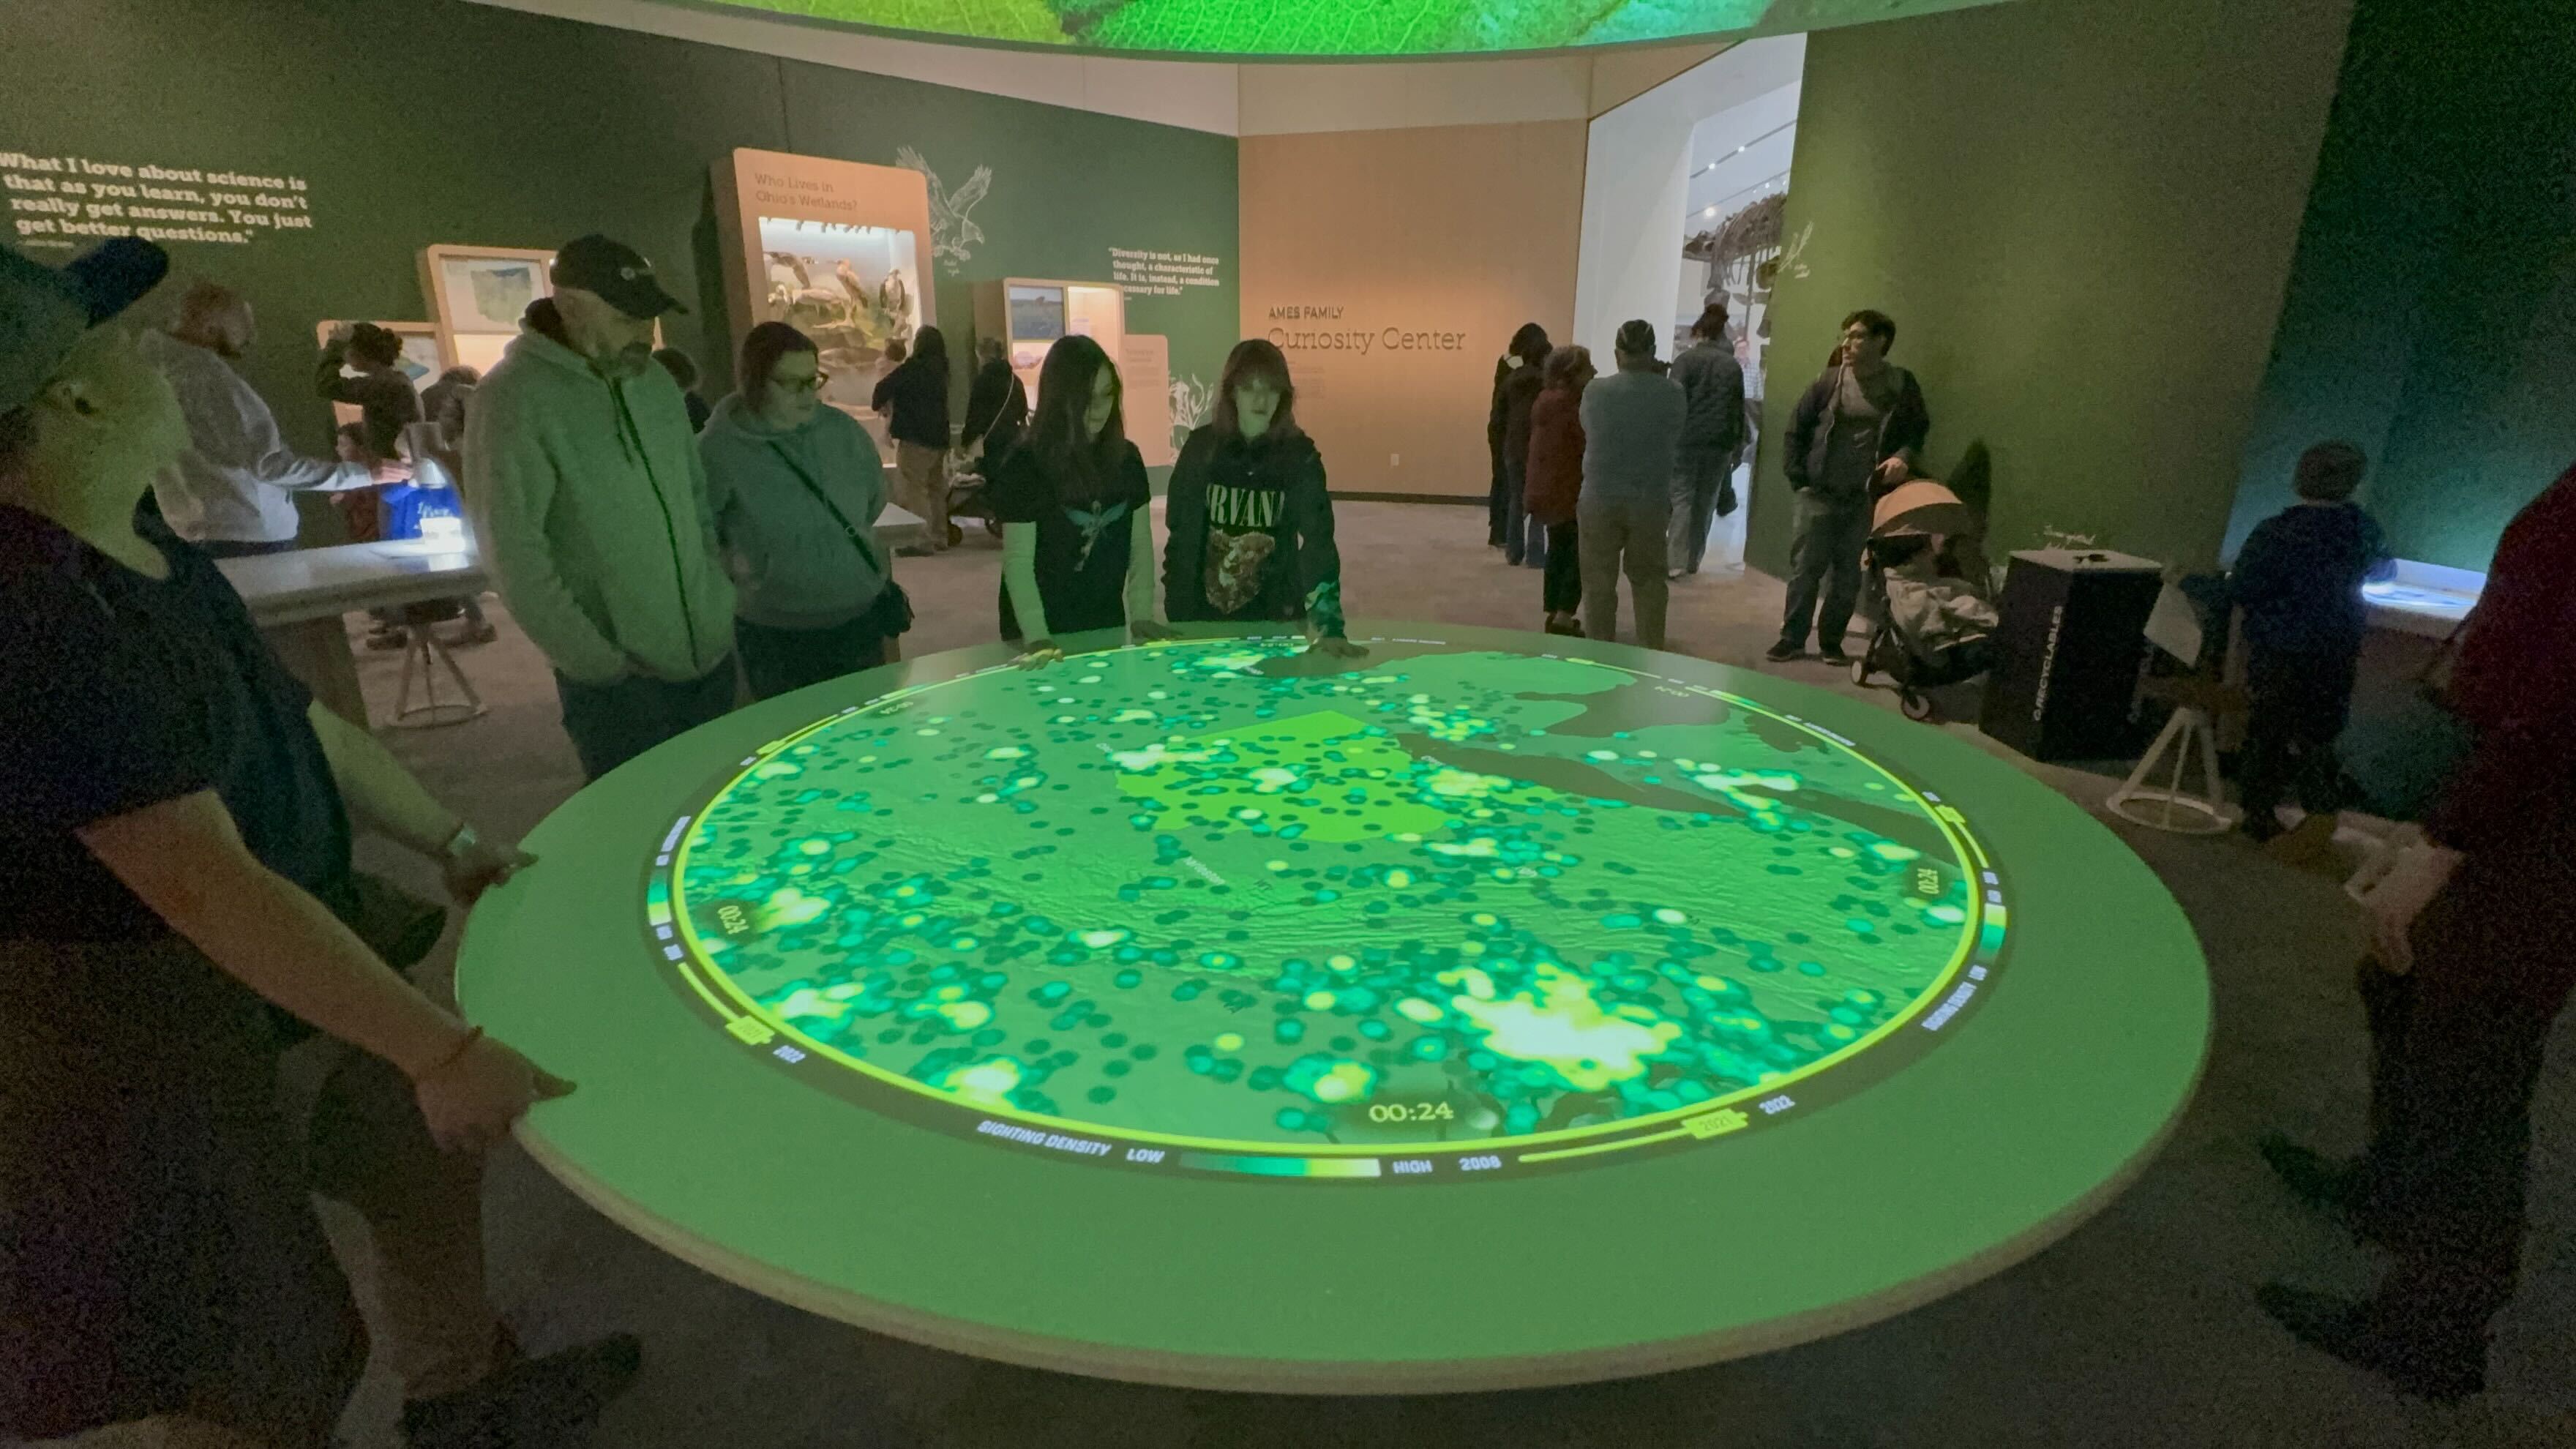
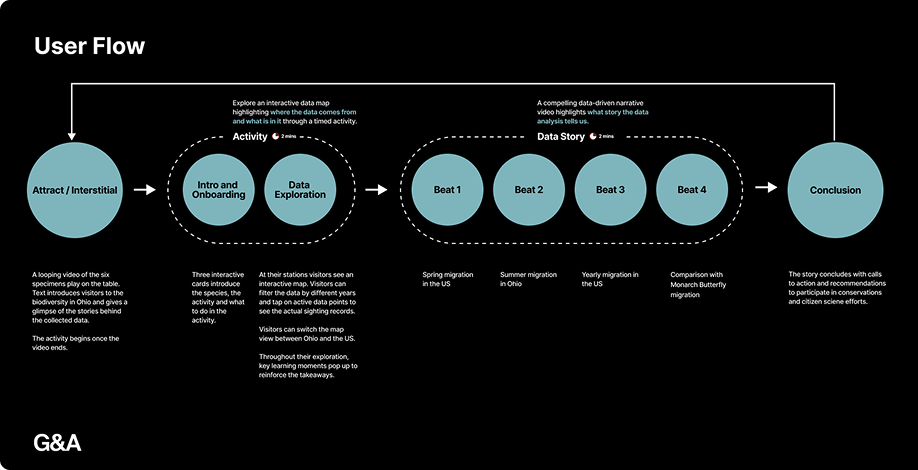
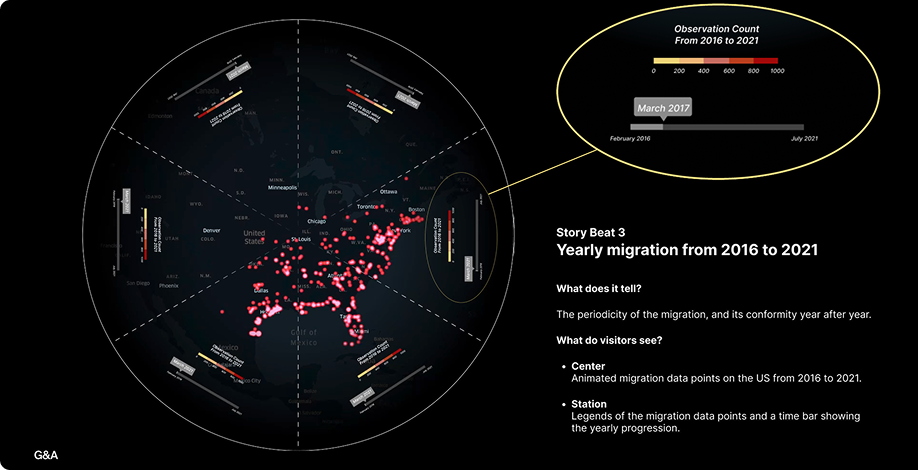
A 9-foot multi-user touch table about six Ohio species and what they reveal about local ecosystems. The flow opens with a looping video of the six species, moves into open exploration of a data map, and ends with an animated sequence on each species' role. Along the way, visitors see how citizen scientists track change through field observation and long-term monitoring.
Use the tools of a field scientist
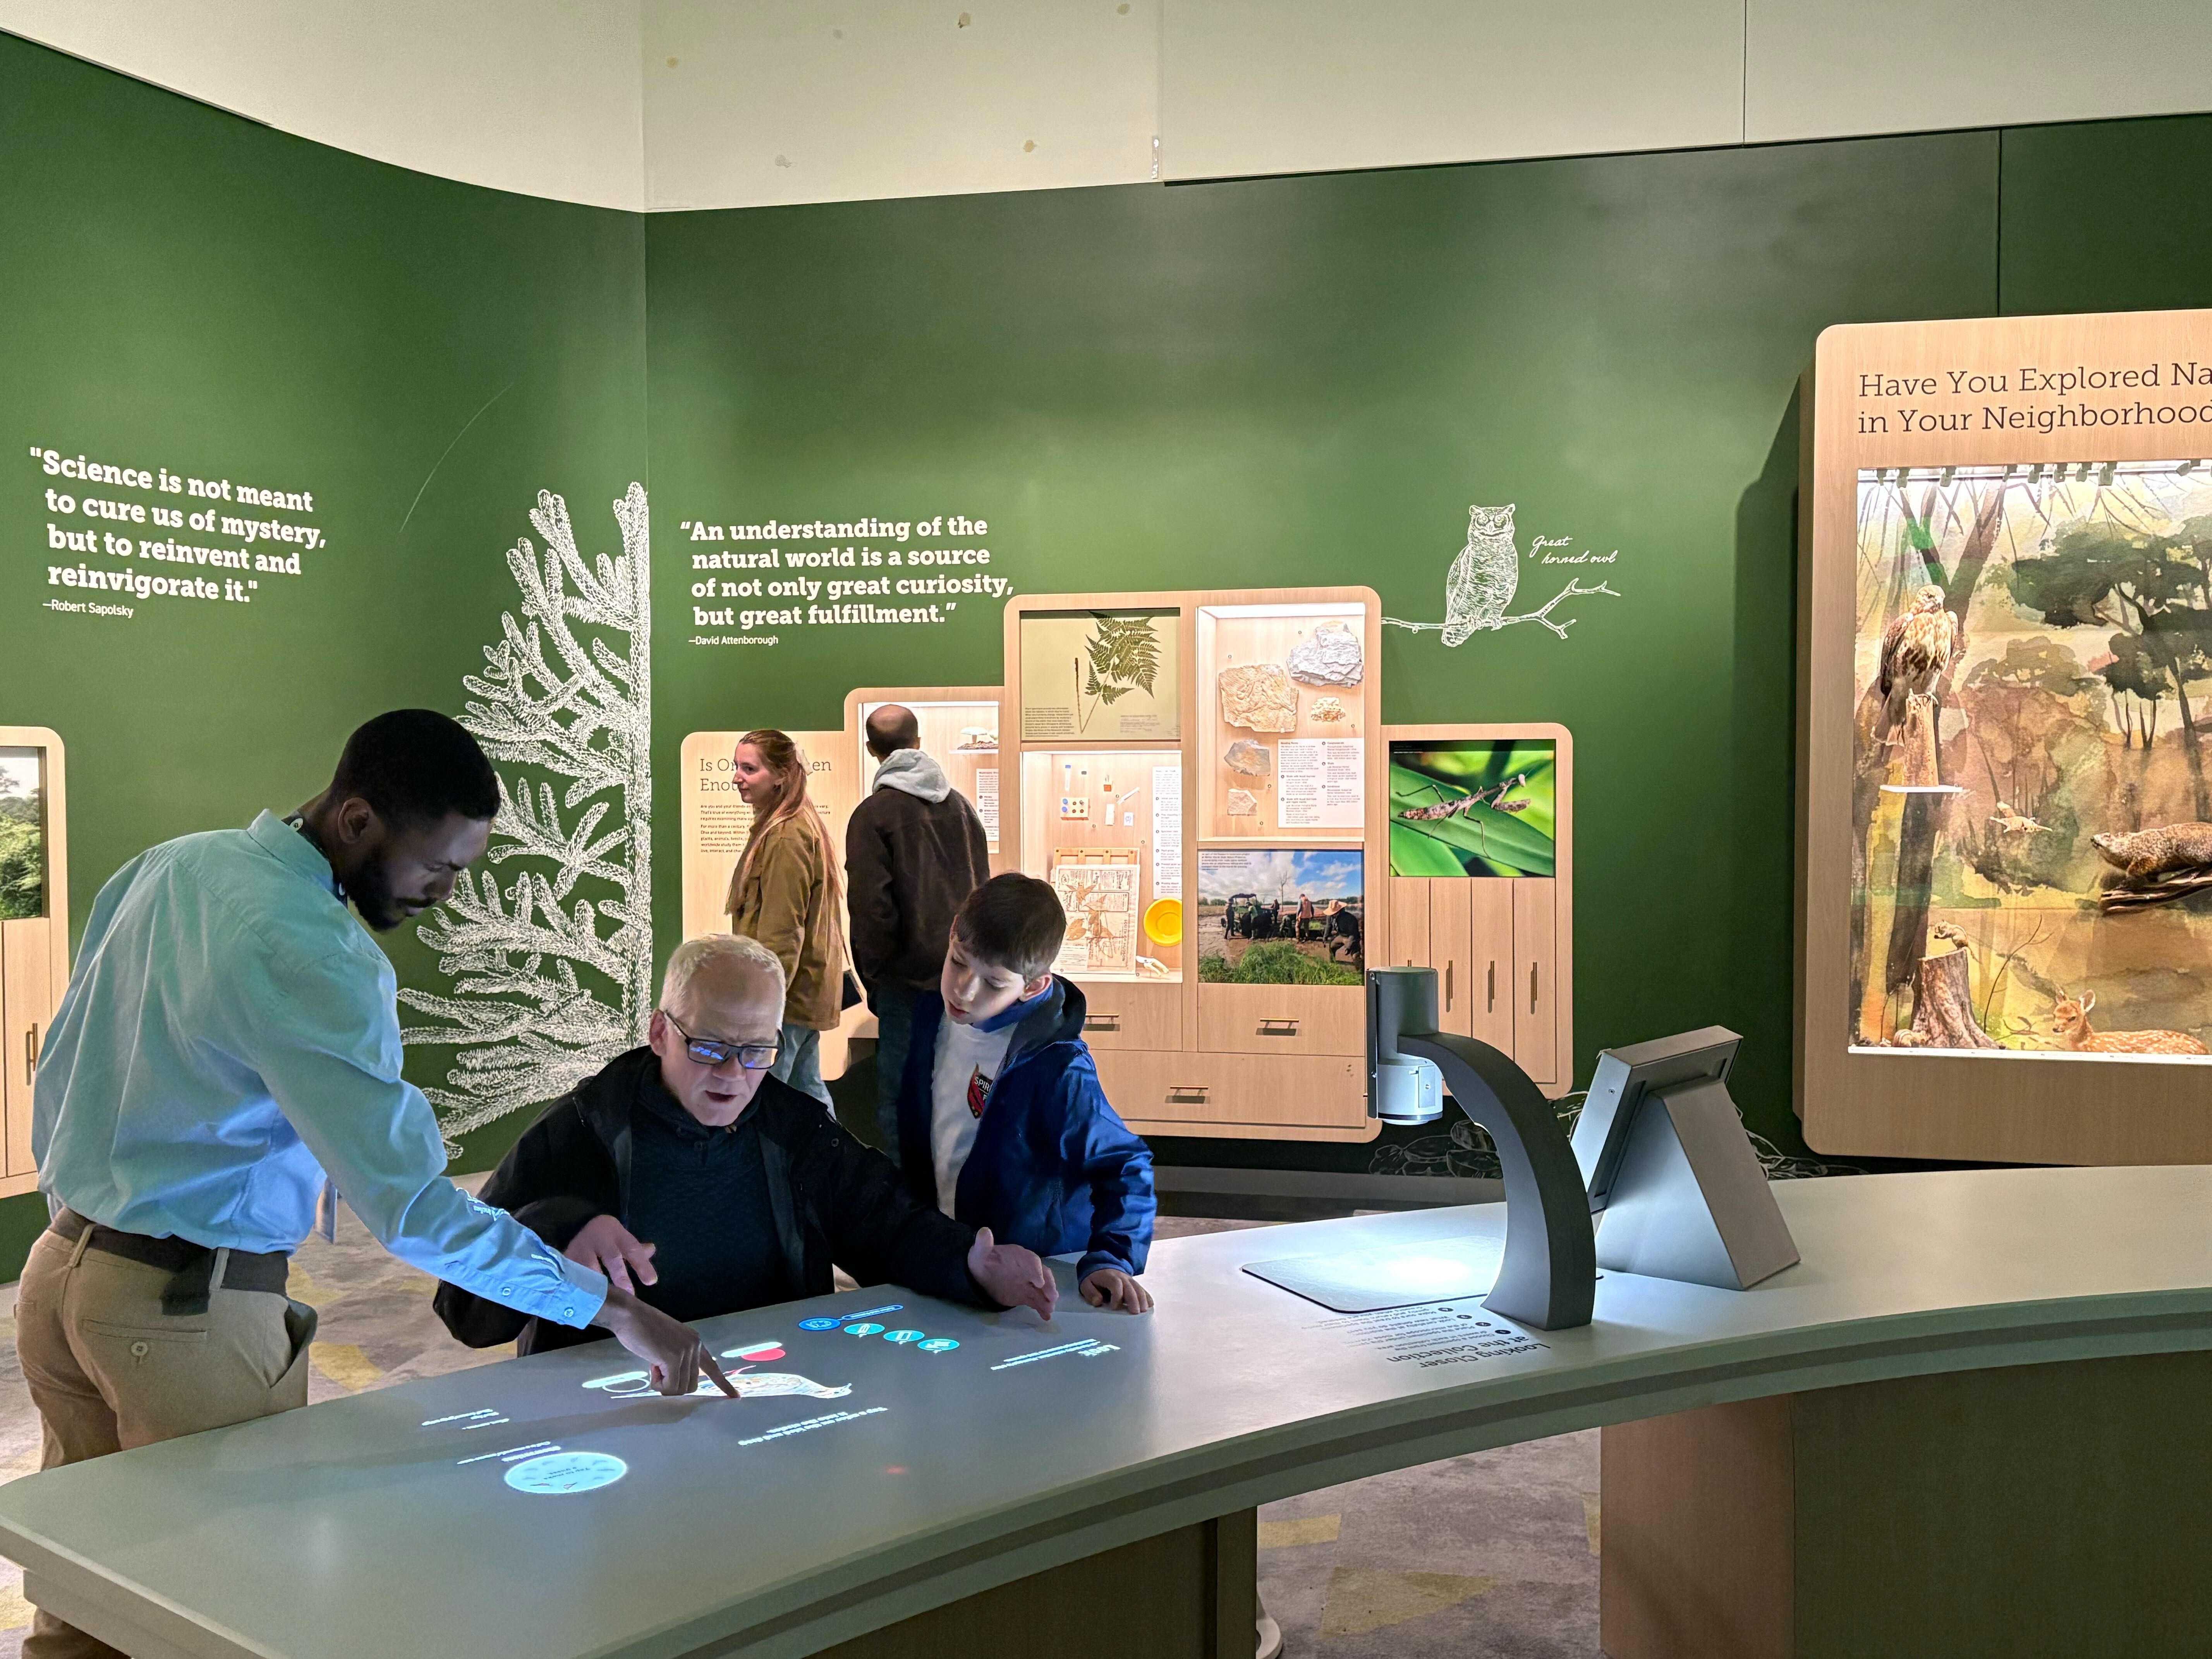
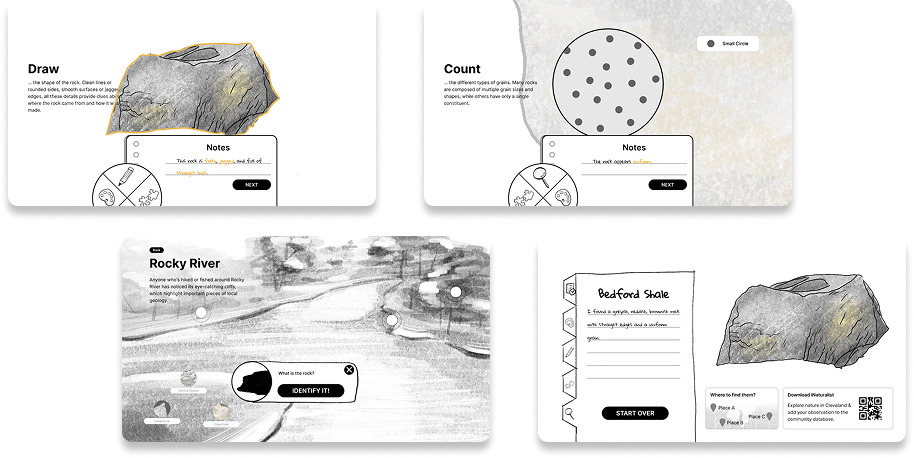
A touch-based projection interactive for identifying Ohio birds, rocks, insects, and plants. Visitors pick a category, then narrow down what they see with digital versions of real field methods: measuring a bird with two fingers, tracing outlines, matching pigments, and listening to birdsong.
A crank instead of a slider
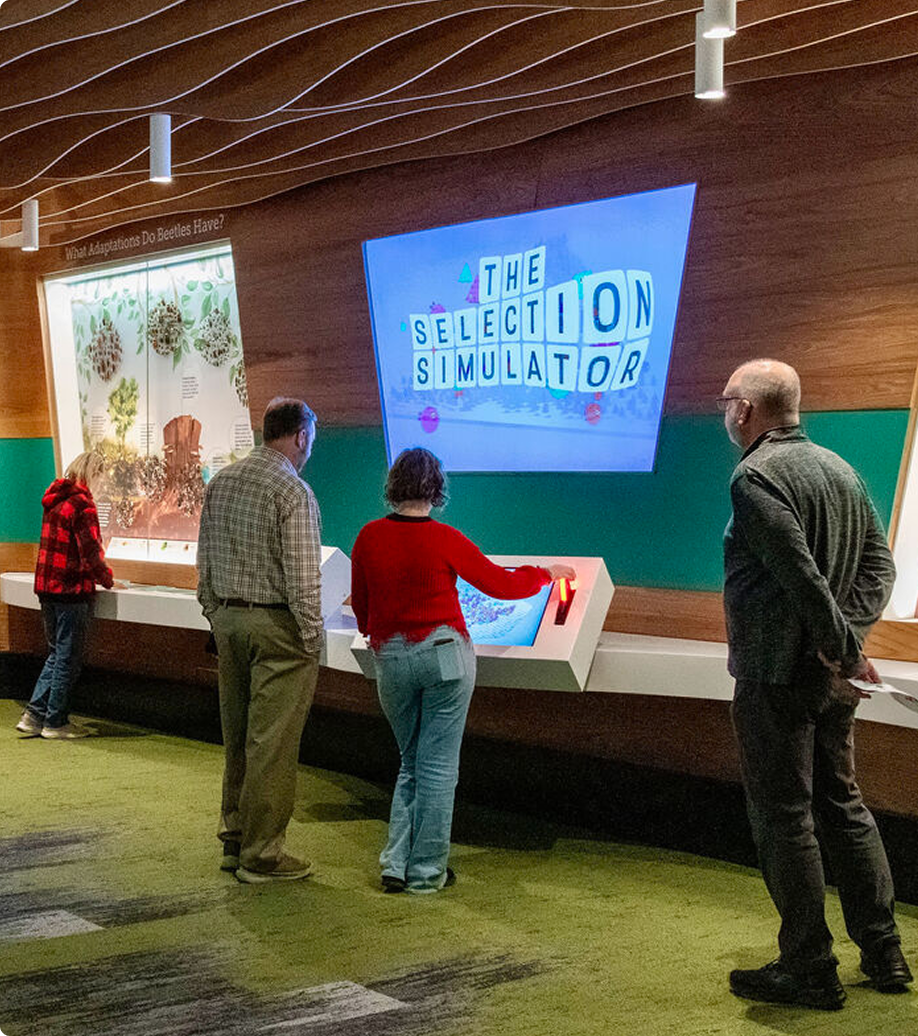
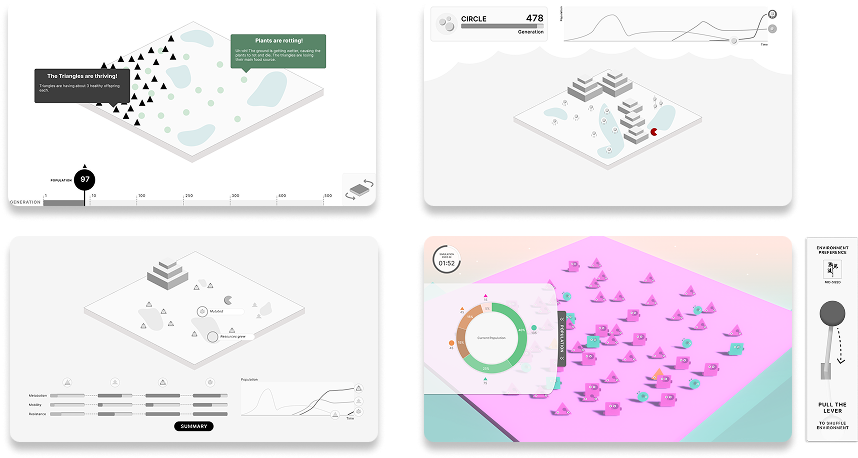
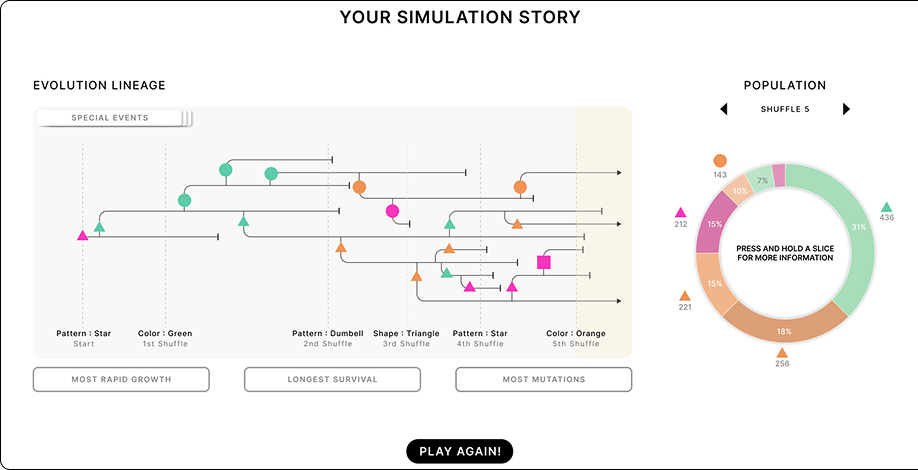
The Selection Simulator shows evolution playing out on fictional species. I pushed for a physical hand crank over a touchscreen slider, so visitors change the environment with their own hands. The flow runs from onboarding to simulation to a summary that shows how each event shaped the species tree. The main screen went through four iterations; the crank arrived in the last one.
Process
Every piece followed the same path: visitor flow, wireframes, testing or client review, then on-site installation.
Outcome
The museum reopened on December 15, 2024. It was later named No. 4 Best New Museum in America in USA TODAY 10Best's 2026 Readers' Choice Awards.
In Architectural Record, G&A managing director Joshua Gallagher said: "All of the interactives, both physical and digital, are driven by ease of use balanced with immersive scientific information."